Cut Lines in SOFiSTiK Graphic 2020
Quad element results are presented across an entire slab. Or when highlighting specific parts – just in selected sections. However, in some cases, it becomes handy when showing results along a line – to be more precise – a “Cut Line”.
In this post, you’ll learn about “Cut Lines” in SOFiSTiK FEA. How to create them and how to visual results in SOFiSTiK Graphic 2020 (former WiNGRAF).
Post-processing takes a vast amount of time during a project’s lifecycle. Besides evaluating results during the calculation, creating the documentation to end up with a proper final report is every enginers daily routine.
Results of slabs, walls or areas are presented with filled areas, iso areas or isolines. The latter is my favourite.
But there is another option to present results for slabs, especially for sections requiring further investigation – “Cut Lines”.
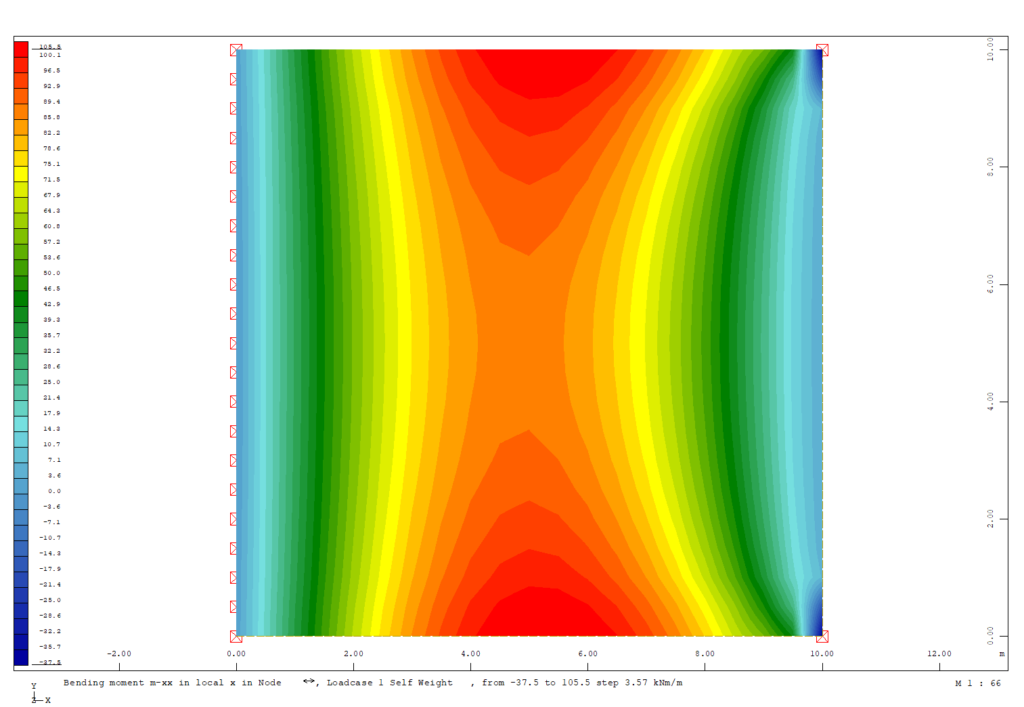
“Cut Lines” allow to present results of quad elements from “node values” or “averaged element values” along a line. The graphic below shows the bending moment m-xx in as an Iso-Area.
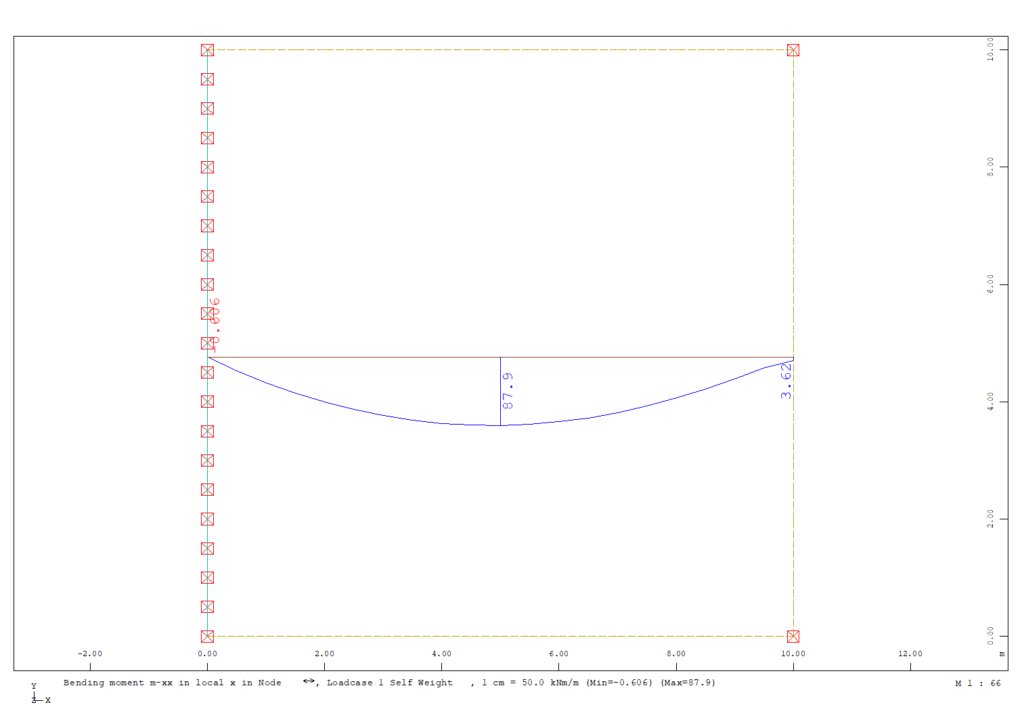
The graphic below also shows the bending moment mxx, but along a single “Cut Line”.
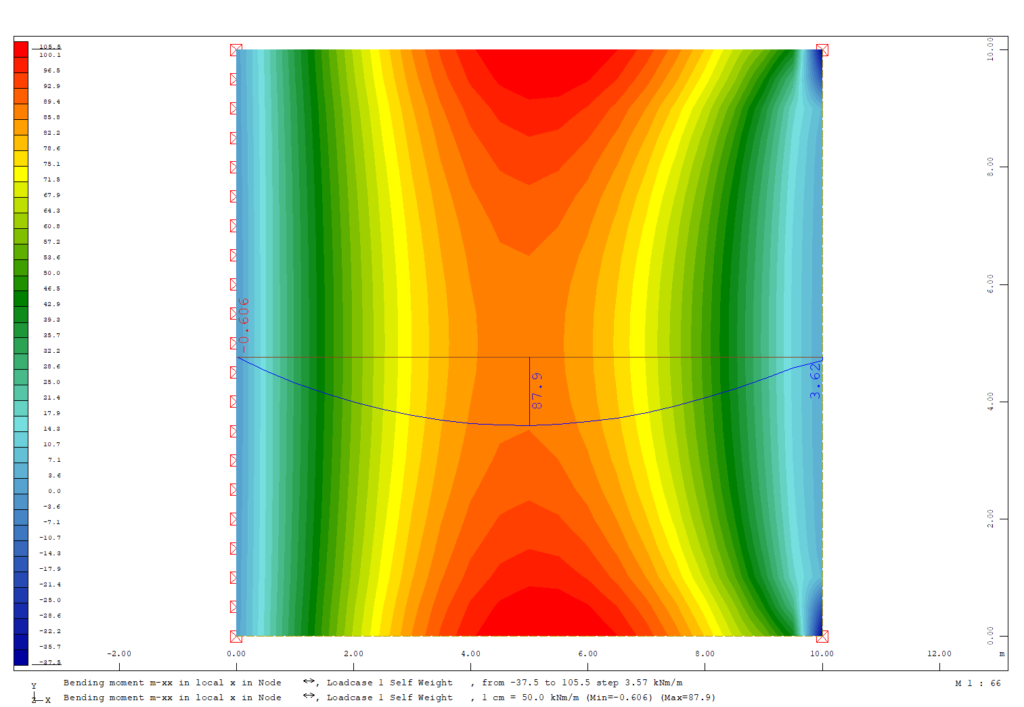
Combining both, results of the Iso-Area and the “Cut Line” is possible too, using the available layer structure of SOFiSTiK Graphic.
“Cut Lines” can be defined in two different places. In the post-processing within SOFiSTiK Graphic, which is the most known method. Or already in the pre-processing stage in SOFiPLUS, which is available since SOFiSTiK 2020.
Define and Manage Cut Lines in SOFiSTiK Graphic (WiNGRAF)
SOFiSTiK Graphic provides you with the option to draw “Cut Lines”. As SOFiSTiK Graphic’s purpose is to represent results instead of drawing lines, the definition is ok. But don’t expect the same flexibility as creating them in Autocad. I’ll come back to how to draw “Cut Lines” in SOFiPLUS later.
However, having the option within SOFiSTiK Graphic, it’s still a welcome opportunity to quickly get results along or perpendicular to a line.
1 Where can you find the command to draw a “Cut Line”
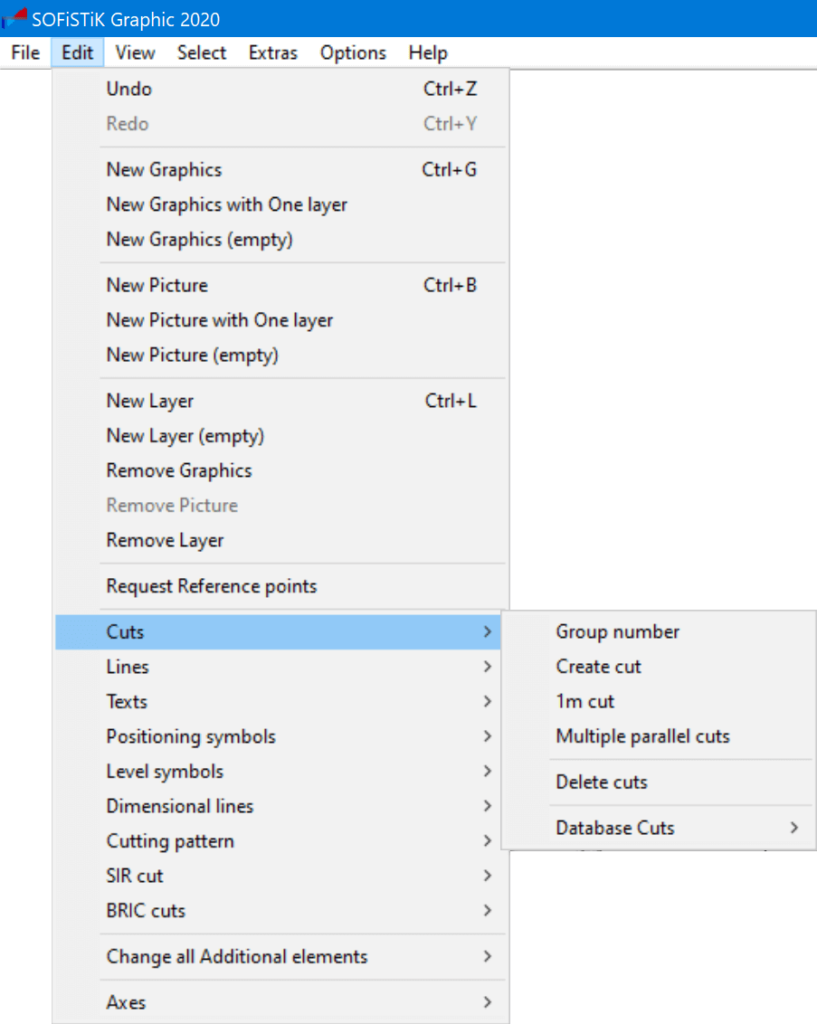
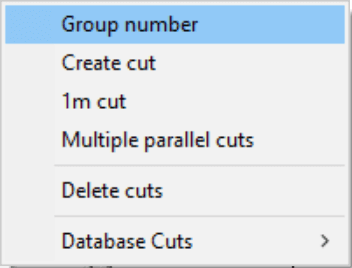
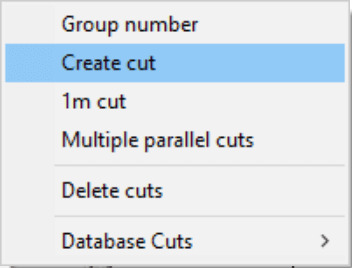
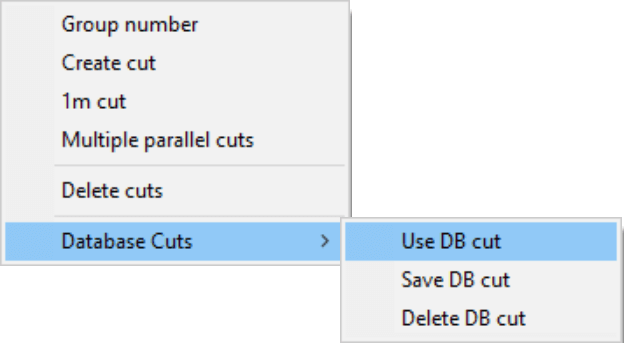
The section “Cuts” can be found in the menu “Edit”. You’ll find several options there.
+Group number
The “Group number” is essential to organise the “Cut Lines” within your graphic. The default “Group number” is “0”.
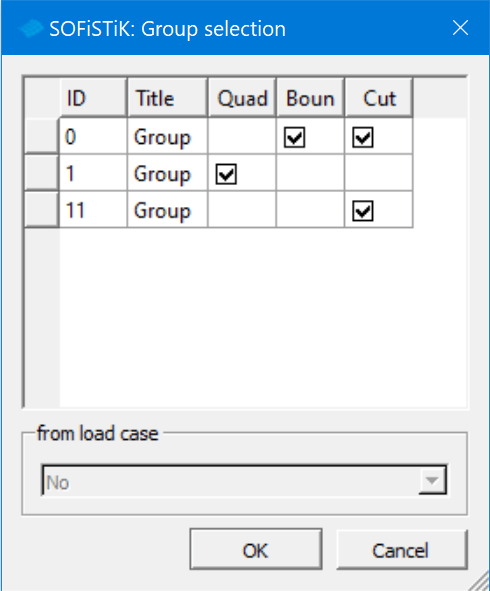
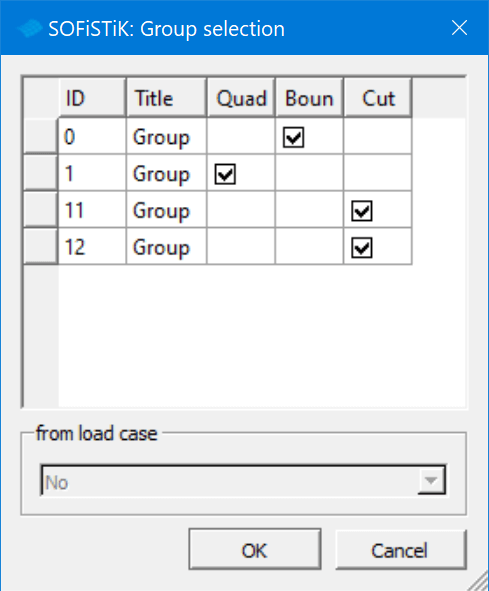
SOFiSTiK Graphic provides you with a group selection dialogue box – SOFiSTiK: Group selection”. You can find it in the menu “Select” section “Groups” and “Define Groups”
Unfortunately, there is no option to change the group number of an existing “Cut Line” in “Graphic” afterwards.
However, it doesn’t mean that there is no other way although it’s not a straight forward one. Let’s do a short detour to check out the option.
The text interface allows you to change the “Cut Line” group number. There are just a few things you need to know to get it done.
The following is only valid if you use the “Interactive Graphic” task within SOFiSTiK Structural Desktop.
Imagine the following; you created a bunch of “Cut Lines” in SOFiSTIK Graphic. And you also assigned different group numbers to each of them. However, for what reason ever, you’d like to change a group number of a single “Cut Line”.
In my example, I have two “Cut Lines”. One was assigned to group “0” and the other one to group “11”. And I’d like to reassign the one in group number “0” to group number “12”.
First, save and close “Graphic”.
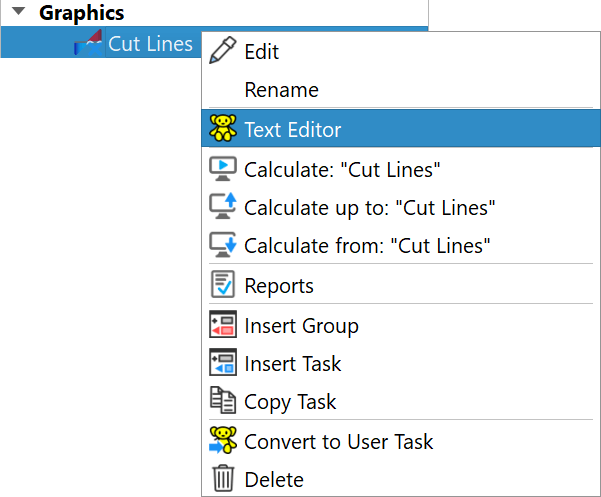
Right-click on the “Interactive Graphic” task, I renamed it to “Cut Lines”. And select “Text Editor”.
Teddy opens in SOFiSTiK Structural Desktop.
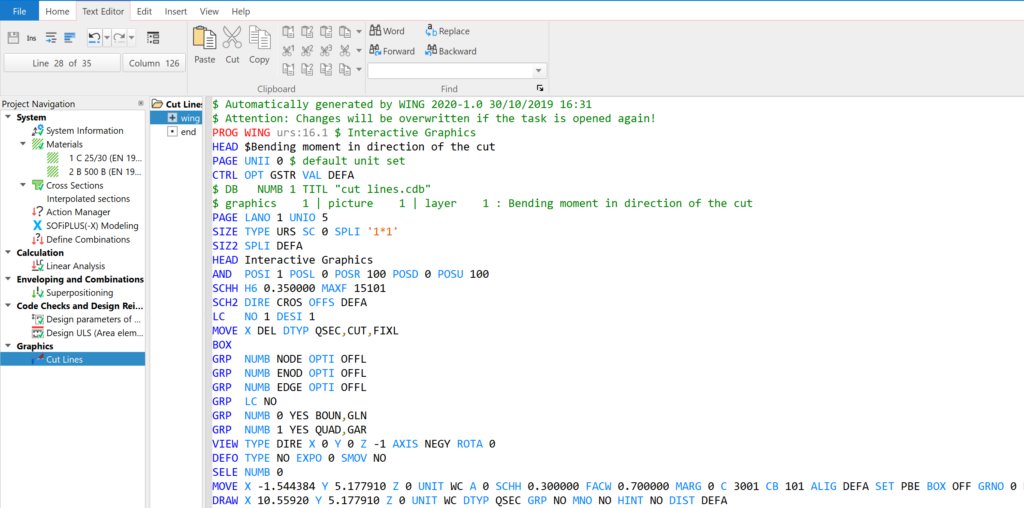
Now you need to find the input line in which the group number of the “Cut Line” was defined. Look for the command “MOVE”.
In this example we have 2 “Cut Lines” and also 2 “MOVE” commands followed from “DRAW”.

Now look for the input “GRNO” within the “MOVE” command line. To the right of the “GRNO” you’ll find a 0. Change the 0 to 12.

Now save the project.
You can double-click on the “Interactive Graphic” task, or in my example, the renamed “Interactive graphic” task “Cut Lines”, and check the change. Go to “Select” section “Groups” and open “Define Groups”.
Well done, you just used CADiNP to modify the group number of a “Cut Line”!
+ Create Cut
Creating a “Cut Line” in “Graphic” is straight forward. Navigate to the Section “Cuts” within the menu “Edit”. And click on the “Create cut” command.
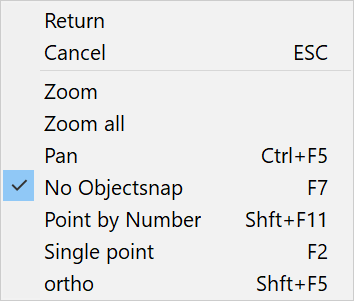
In the “Graphic” command line, which is by default on the bottom of the application window, you’ll be asked to define the first point of the “Cut Line”, which is a polyline. There is a snap function – which is limited to points – and an ortho mode available. To get the context menu use the right-click.
+ 1m Cut
This command allows you to create a “Cut Line” with a defined length. There will be further information within the command line, so pay attention to it. The default setting is a line with 1m length and an angle of 0,0.
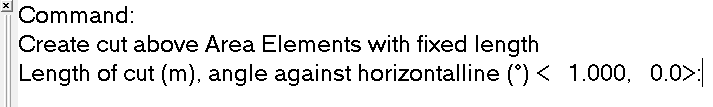
To change the properties of the “Cut Line” you need to enter length [m], angle [°].
To amend the default to 2-meter length and an inclination of 45° – enter 2,45 and confirm it with ENTER. The new settings are now available to create the new “Cut Line”.
It’s possible to place several lines in the project. To close the command, use the ESC key on your keyboard.
+ Multiple parallel cuts
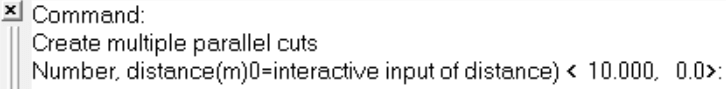
The command allows you to create multiple “Cut Lines”. As initial input within the command line of “SOFiSTiK Graphic”, the number of cuts and the distance between the lines is required. For the latter “0” considers the distance between the endpoint of the drawn baseline and the picked point which indicates the distribution direction.
The default is set to 10 “Cut Lines” with a distance of “0”.
Confirm the settings with “ENTER” and draw the first “Cut Line”.
Now point in the direction you want to copy the “Cut Lines”. Keep in mind; the distance is set to “0”, the value will be extracted from the endpoint and the point you indicate the direction.
The new “Cut Lines” are generated immediately. Use the “ESC” key on your keyboard to close the command.
To modify the default values of the number and distance you need to enter a number [-], distance [m].
+ Delete cuts
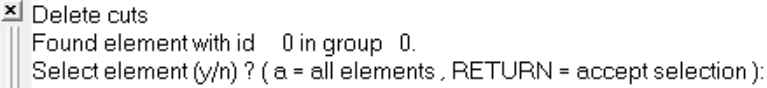
Removing “Cut Lines” from the projects is as important as creating them. However, one needs to get used to the command. You’ll find further information in the command line.
There are two options available to select and remove lines:
• Select specific “Cut Lines”
When the command is active, and you look at the “Cut Lines” you have created, you’ll recognise that one is highlighted blue. This line represents the current selection. If you want to remove it enter “y” – to keep it enter “n”. This process can be done until you have selected all the lines you want to be removed. Confirm the selection with “ENTER”.
• Select all “Cut Lines”
To remove all “Cut Lines” enter “a” and confirm the selection with “ENTER”.
If you remove a “Cut Line” by mistake, use the “UNDO” command.
+ Database cuts
There is the option to save “Cut Lines” in the SOFiSTiK database (CDB). And to use them in different “Interactive Graphic” tasks. Unfortunately, it isn’t possible to select those “Cut Lines” saved in the CDB by the group number. Which can get quite confusing when being interested in a specific cut result only.
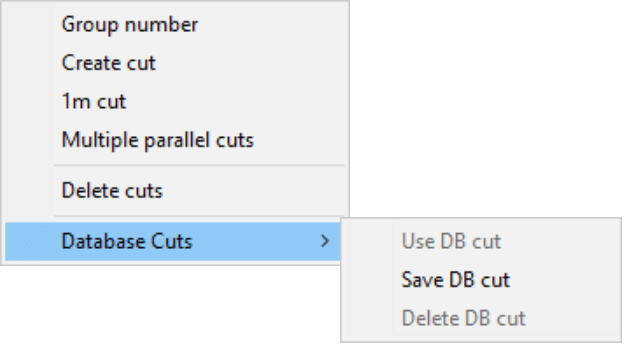
There are three commands
• Use DB cut
It’s the on/off switch to show the database cut lines.
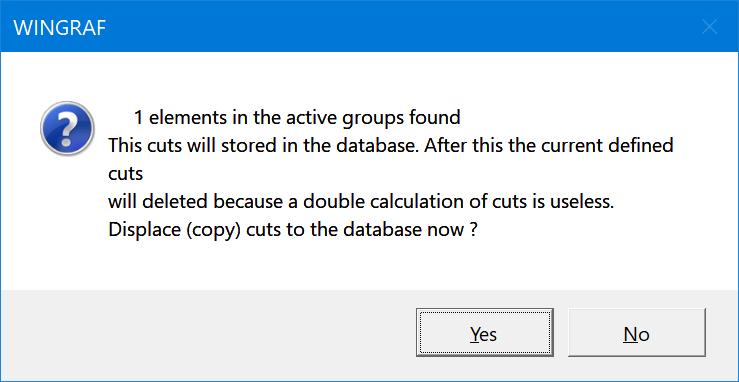
• Save DB cut
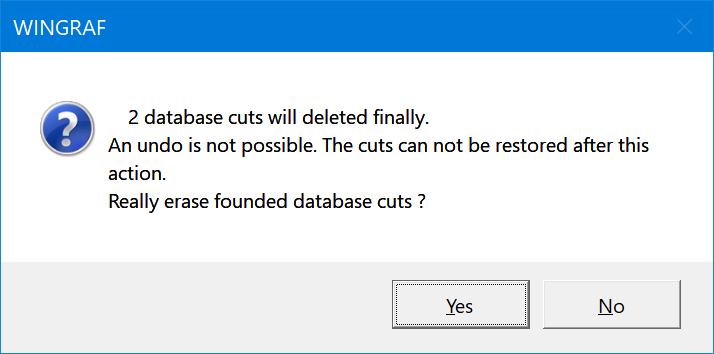
Saving a “Cut Line” to the database requires creating one in the first place. Saving the “Cut Line” to the CDB will delete the created cut lines to avoid duplicates. Restoring them isn’t possible anymore.
• Delete DB cut
“Cut Lines” can’t be selected separately. The “Delete DB cut” command will remove all “Cut Lines” stored in the CDB.
2 Define Cut Lines in SOFiPLUS
Creating “Cut Lines” in SOFiPLUS is most accurate and also simple.
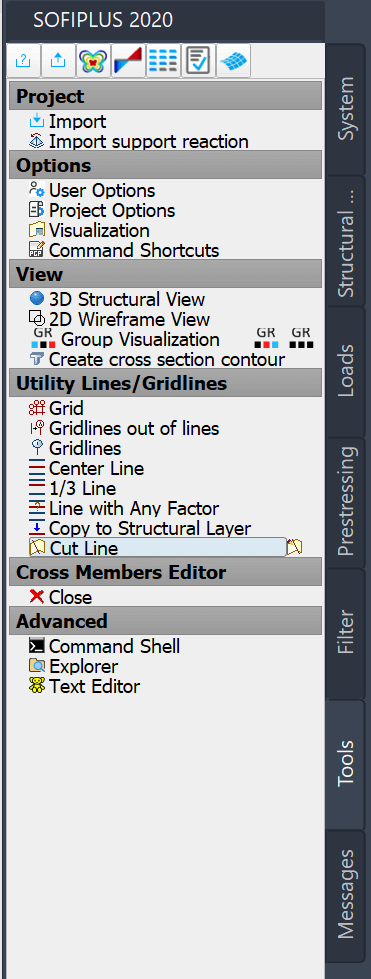
In the SOFiPLUS sidebar within the tab “Tools” and section ”Utility Lines / Gridlines” you’ll find the command “Cut Lines”.
The input is straight forward. After starting the command, you can define the group number of the “Cut Line” and start drawing the line.
To modify the group number afterwards, double-click the “Cut Line” or use the “modify Cut lines” command to the right of the “Create Cut Line” command in the SOFiPLUS sidebar.
Assigning the group number to the cut lines is available since version 2020.
“Cut Lines” created in SOFiPLUS are database cuts. Modifying the group number or geometry isn’t possible outside SOFiPLUS.
To visualise results for the “Cut Lines” within “SOFiSTiK graphic” ensure the option “Use DB cut” is activated.
Wrap-Up
Besides having the standard visualisation options such as iso-lines, iso-areas or filled areas “Cut Lines” are a great additional option for a more detailed representation of results.
With the capability of drawing “Cut Lines” and assigning group numbers within SOFiPLUS; creating the “Cut Lines” get’s even better and more accurate.
Software version: SOFiSTiK FEA 2020-2.